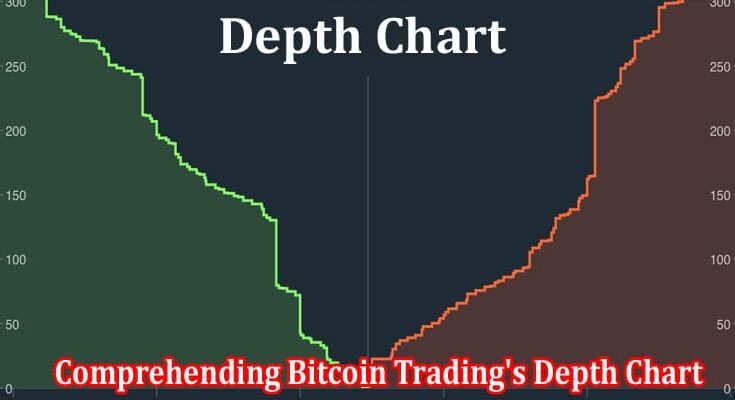
Bitcoin trading, like any other form of financial trading, has its own unique set of tools and indicators that traders use to understand market trends and make informed decisions. Two such tools are the depth chart and the order book. These tools provide a visual representation of market activity, offering insights into the supply and demand for Bitcoin at various price levels. You may visit gpt-definity.com/, which will provide you with the greatest experience in bitcoin trading as well as other cryptocurrencies.
What is a Depth Chart?
A depth chart is a visual tool that illustrates the buying and selling interest in Bitcoin. It’s essentially a snapshot of the open orders for the cryptocurrency, offering a clear picture of the current market demand (buy orders) and supply (sell orders). The term ‘depth’ refers to the volume of the market at various price points.
The depth chart is divided into two sections. On the left, you’ll find the buy orders (also known as bids), while the sell orders (known as asks) are displayed on the right. The intersection of these two sections represents the prevailing market price. The chart’s vertical axis denotes the total volume of orders, whereas the horizontal axis displays the different price levels.
Interpreting a Depth Chart
When analyzing a depth chart, one key element to focus on is the ‘walls’. These ‘walls’ symbolize a high accumulation of buy or sell orders at a specific price. If there’s a buy wall, it signifies that there’s a robust demand for Bitcoin at that particular price, which could prevent the price from dropping below that level. Conversely, a sell wall reflects a substantial supply of Bitcoin at a certain price, indicating that the price might not exceed this level.
However, it’s crucial to be aware that depth charts can be subject to manipulation by ‘whales’ or large-scale Bitcoin holders. These entities may place substantial orders to fabricate walls artificially, thereby swaying market sentiment. This tactic can influence other traders’ perceptions and actions within the market.
What is an Order Book?
An order book operates as a dynamic, constantly updated record of buy and sell orders for a particular asset, illustrating the price and volume that traders are prepared to transact. In the context of Bitcoin trading, the order book offers an in-depth perspective of market activity, detailing the quantity of Bitcoins being traded at distinct price thresholds.
The structure of order books includes two sections: bids (purchase orders) and asks (sale orders). Each entry in the bid section represents the maximum price a potential buyer is ready to invest for Bitcoin, while every entry in the ask section indicates the minimum price a seller is willing to receive. This real-time information can provide valuable insights into market trends and potential price movements.
Using the Order Book in Trading
Order books are vital tools in the trading world, offering traders invaluable insights into market sentiment. The balance between buy and sell orders can act as a barometer of market trends. If buy orders exceed sell orders, this may signal a bullish sentiment, suggesting that traders expect the price to rise. In contrast, if there are more sell orders, it could indicate a bearish sentiment, pointing to an anticipated price decrease. These sentiments can assist traders in predicting potential price movements and planning their strategies accordingly.
Furthermore, order books provide traders the ability to pinpoint potential resistance and support levels. Resistance levels are those price points at which selling pressure surpasses buying pressure, halting any further price increase. Conversely, support levels are those price thresholds where buying pressure outweighs selling pressure, preventing the price from falling further. Understanding these levels is critical for traders as they form the basis for developing effective trading strategies and forecasting future market trends. In essence, order books are essential components in financial trading, providing real-time data that can help traders make informed decisions and adapt to shifting market dynamics.
Conclusion
Depth charts and order books serve as potent instruments in Bitcoin trading, offering crucial understanding of market behavior and sentiment. However, as with any trading tool, they are most effective when used alongside other indicators and strategies to provide a comprehensive view of the market. It’s essential to bear in mind that trading encompasses inherent risks. Therefore, it’s prudent to only allocate funds for investment that you can comfortably afford to lose. Always exercise caution and conduct thorough research before diving into trading.

Caroline is a dedicated writer with a passion for keeping readers informed. Specializing in providing the latest news updates and unbiased reviews, she strives to deliver accurate and insightful content. With a keen eye for detail and a commitment to journalistic integrity, Caroline ensures that her readers are always well-informed. Stay tuned for her latest articles to stay up-to-date on current events and trends.


